ETFtracker Guide
This page shows how to use various elements of the ETFtracker app. This is version 3.0 of the app which was updated to this new look on 7th September 2021 (we will continue to add new features over time including merging the Holdings App features into this so we can have a single app).
Additionally, if you are interested in definitions of data in the app click here: ETF Dictionary
Use the buttons below to navigate to a section in this guide and the arrows to move back up
Navigation
MAIN MENU
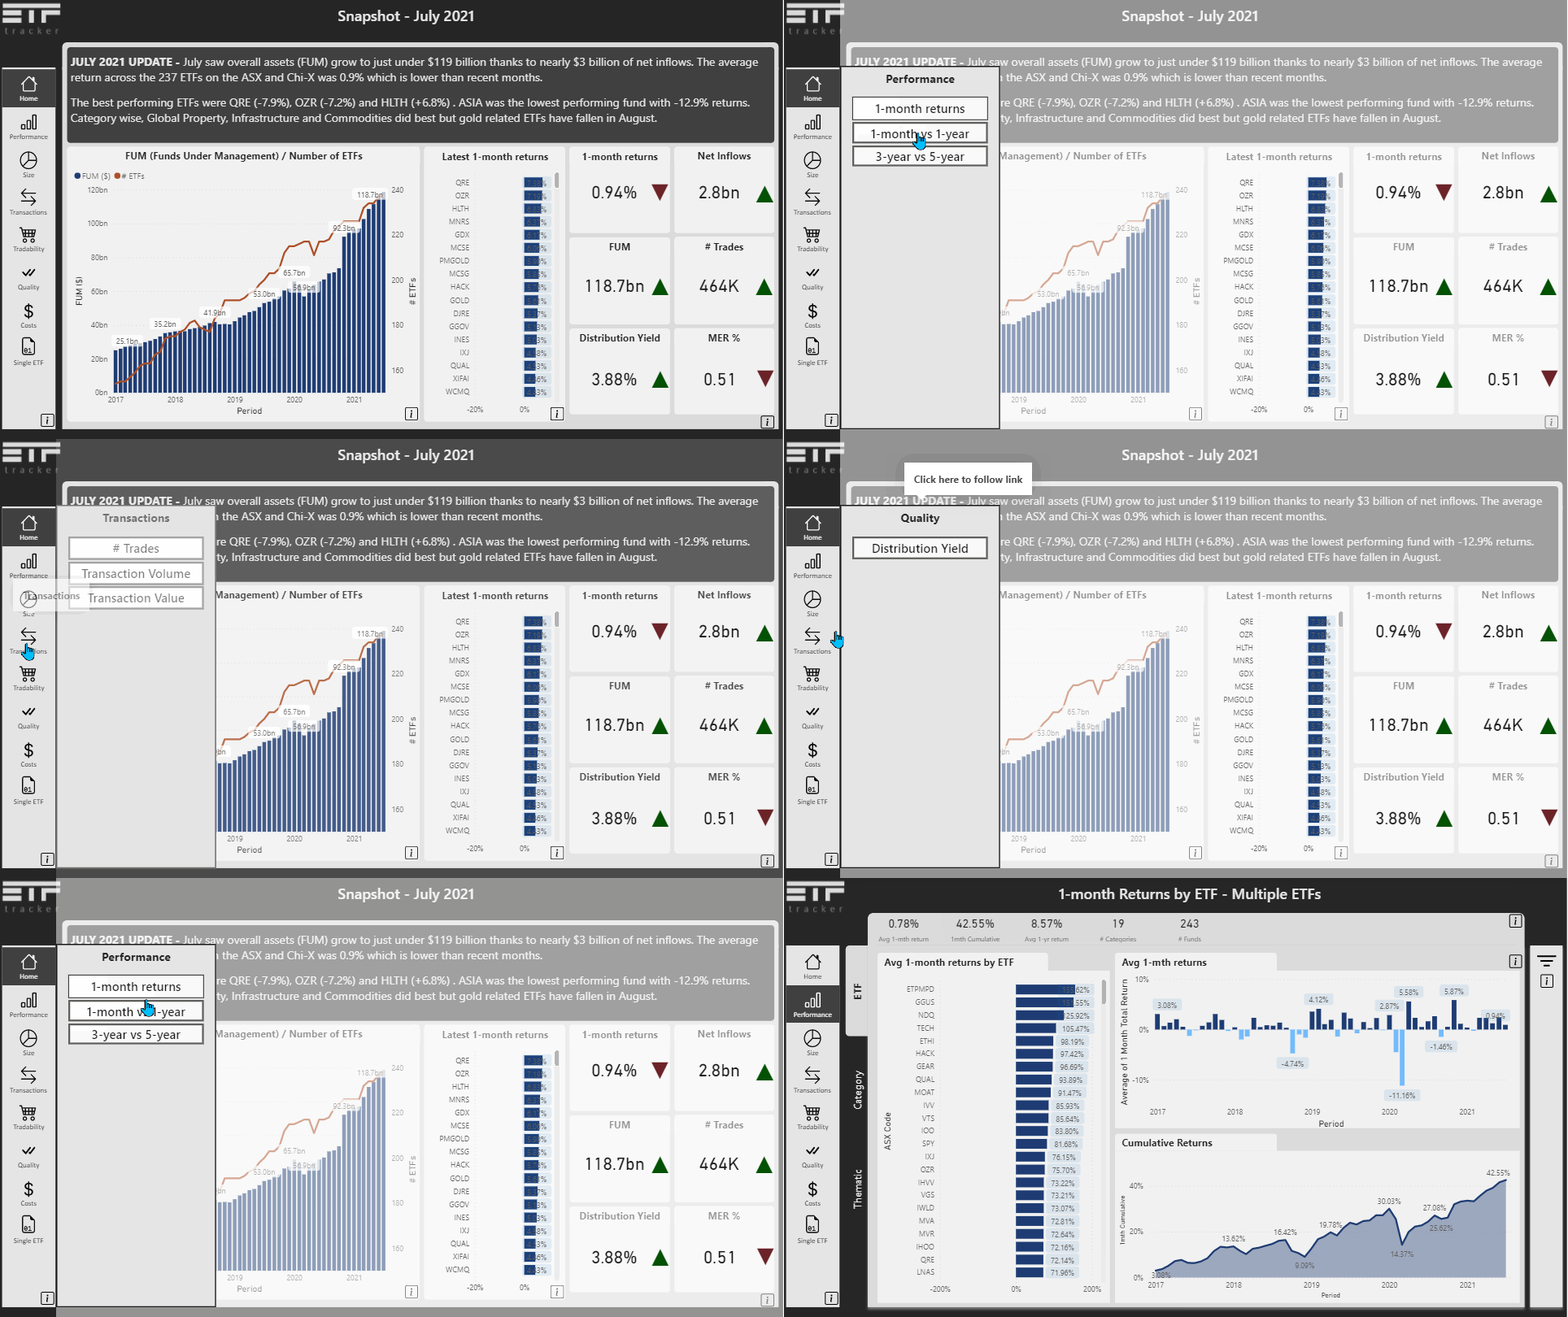
Below we take show how navigation works in the app. The previous app had menu and sub-menu sections strewn across the app and with this update, users can now utilise a side panel menu to view the different options and groupings of ETF metrics that are available in the app.
The menu consists of the following options
-
Dashboards - this shows what has happened in the latest month for the overall ETF markets.
-
Performance - users can either look at 1-month total price returns or 1-month versus 1-year or 3-year versus 5-year returns
-
Size - this looks at both FUM (funds under management) as well as Net Inflows
-
Transactions - the user can look at number of trades, transaction volumes and transaction values in this section
-
Tradability - in this part we compare monthly liquidity to the % spread
-
Quality - in this case it covers the historical dividend yield / distributions
-
Cost - this looks at the Management Expense Ratio (MER) for the funds
-
ETF Snapshots - this section enables users to see a snapshot of individual ETFs and drill through to further details about each of those metrics. Users can filter ETFs and analyse an ETF at a glance.
-
Holdings - TBA - currently, we provide some holdings analysis tools on a separate page, we will be bringing more of these features across to the main ETFtracker app over time.
Below is an animation of how the side panel menus work
SUB-MENUS
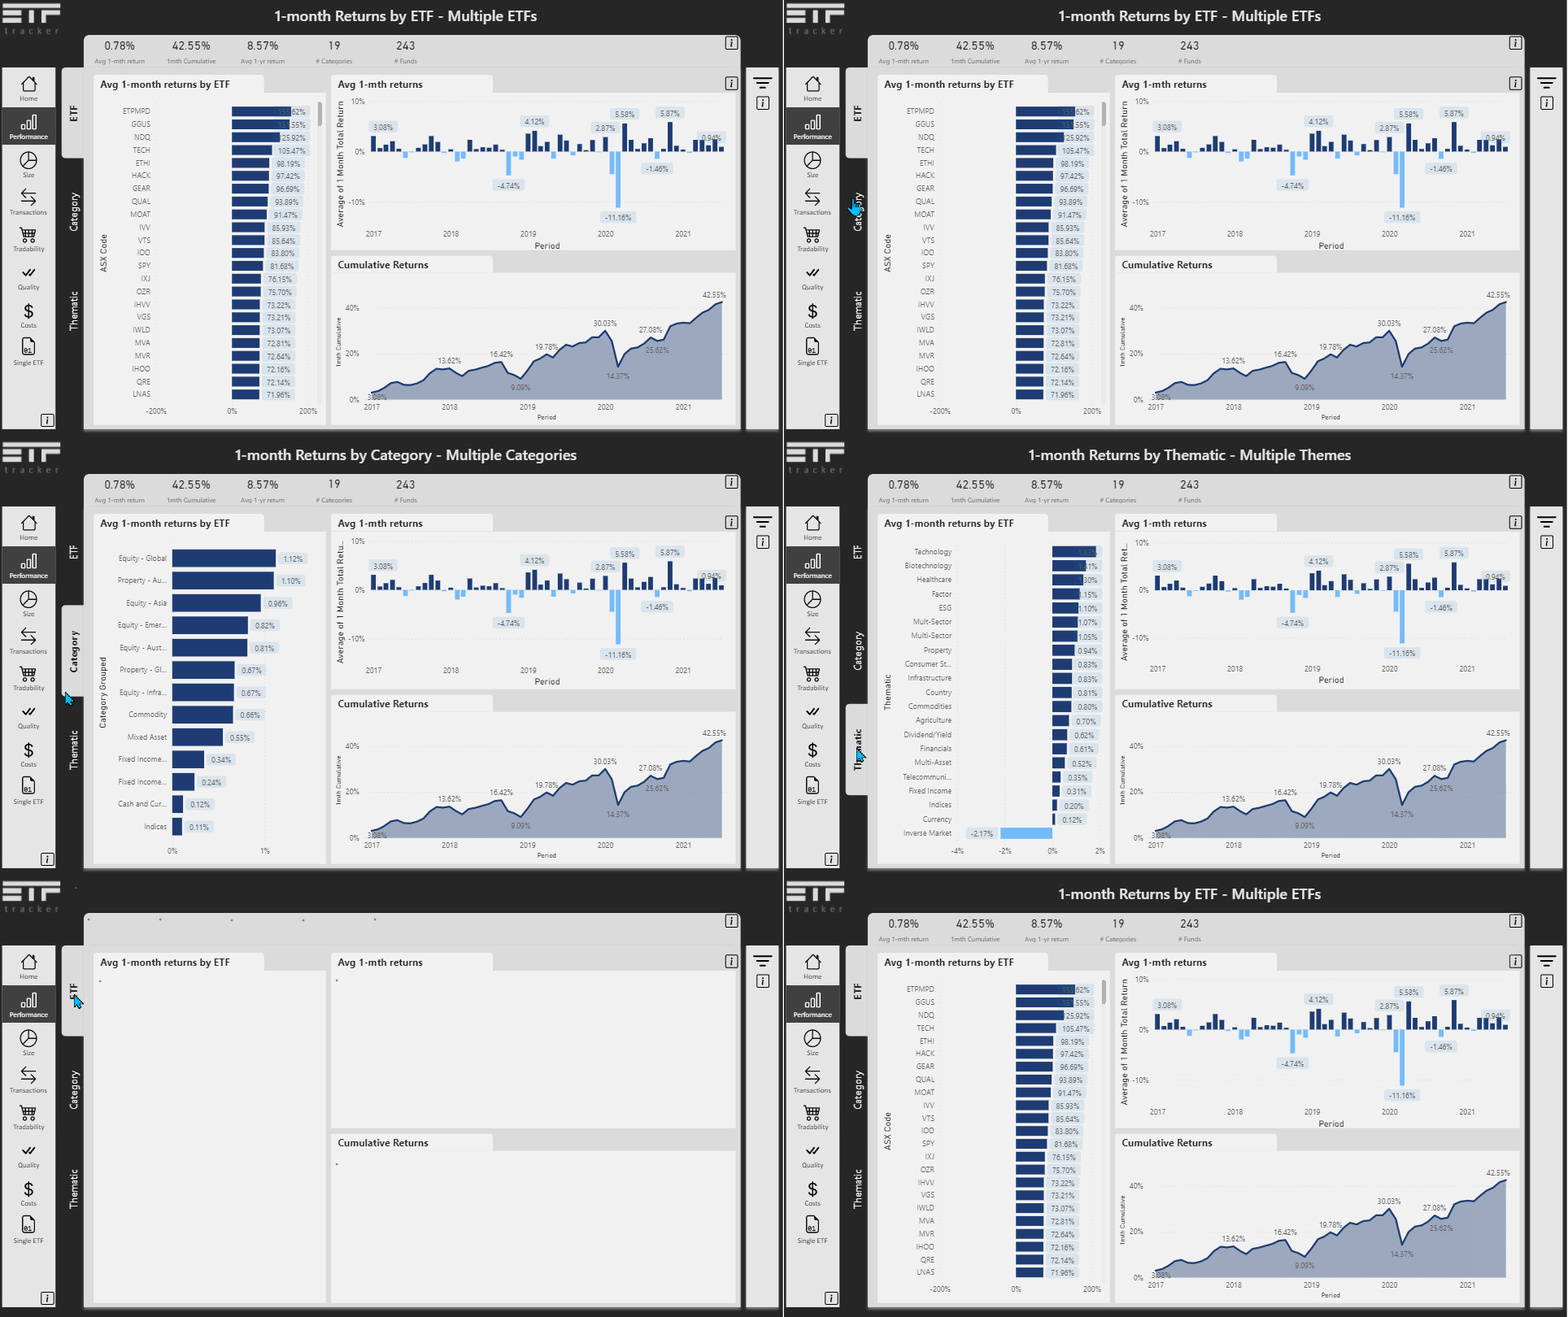
Furthermore, users can change the view they are looking at to either be by ETF, Category or Theme - these are done via the side panel menus
Filtering
With all of the data available in the app, it's important to be able to filter to specific things that are relevant for you. There are 2 ways that users can filter data in the application, via the filter menu and also via interactivity with the charts.
The previous version of ETFtracker saw a limited space for filters to sit at the top of the page which meant only a few types of filters can be provided.
FILTER MENU
In this version we use a popout option (just like the new menu options) to showcase the various filters available.
Below we show how the filter menu works and more filter options will be added in this menu as the app is further developed.
Users can filter on the following options
-
Categories
-
Thematic
-
ETF provider
-
ETF Ticker / Fund Name
-
Date / Period
-
Active vs Passive
Below is an animation of how this works
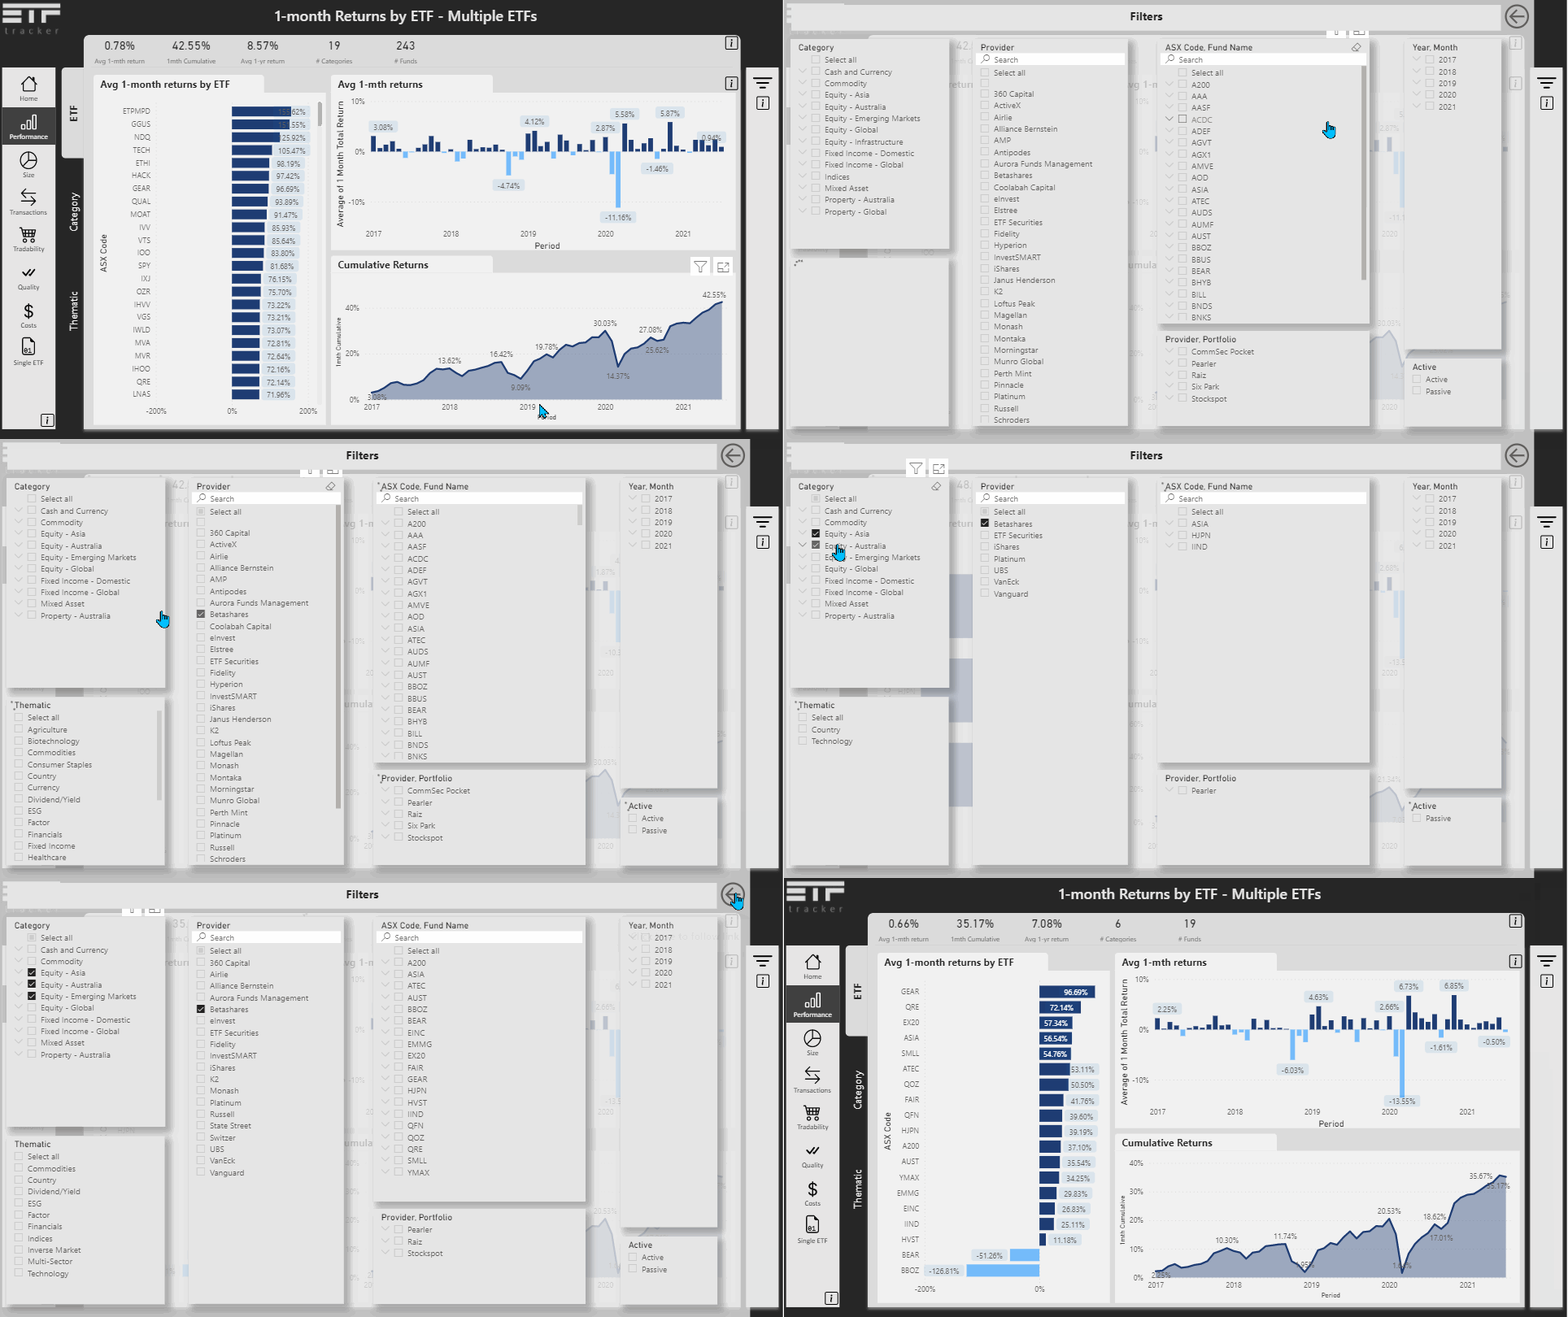
CHART FILTERS
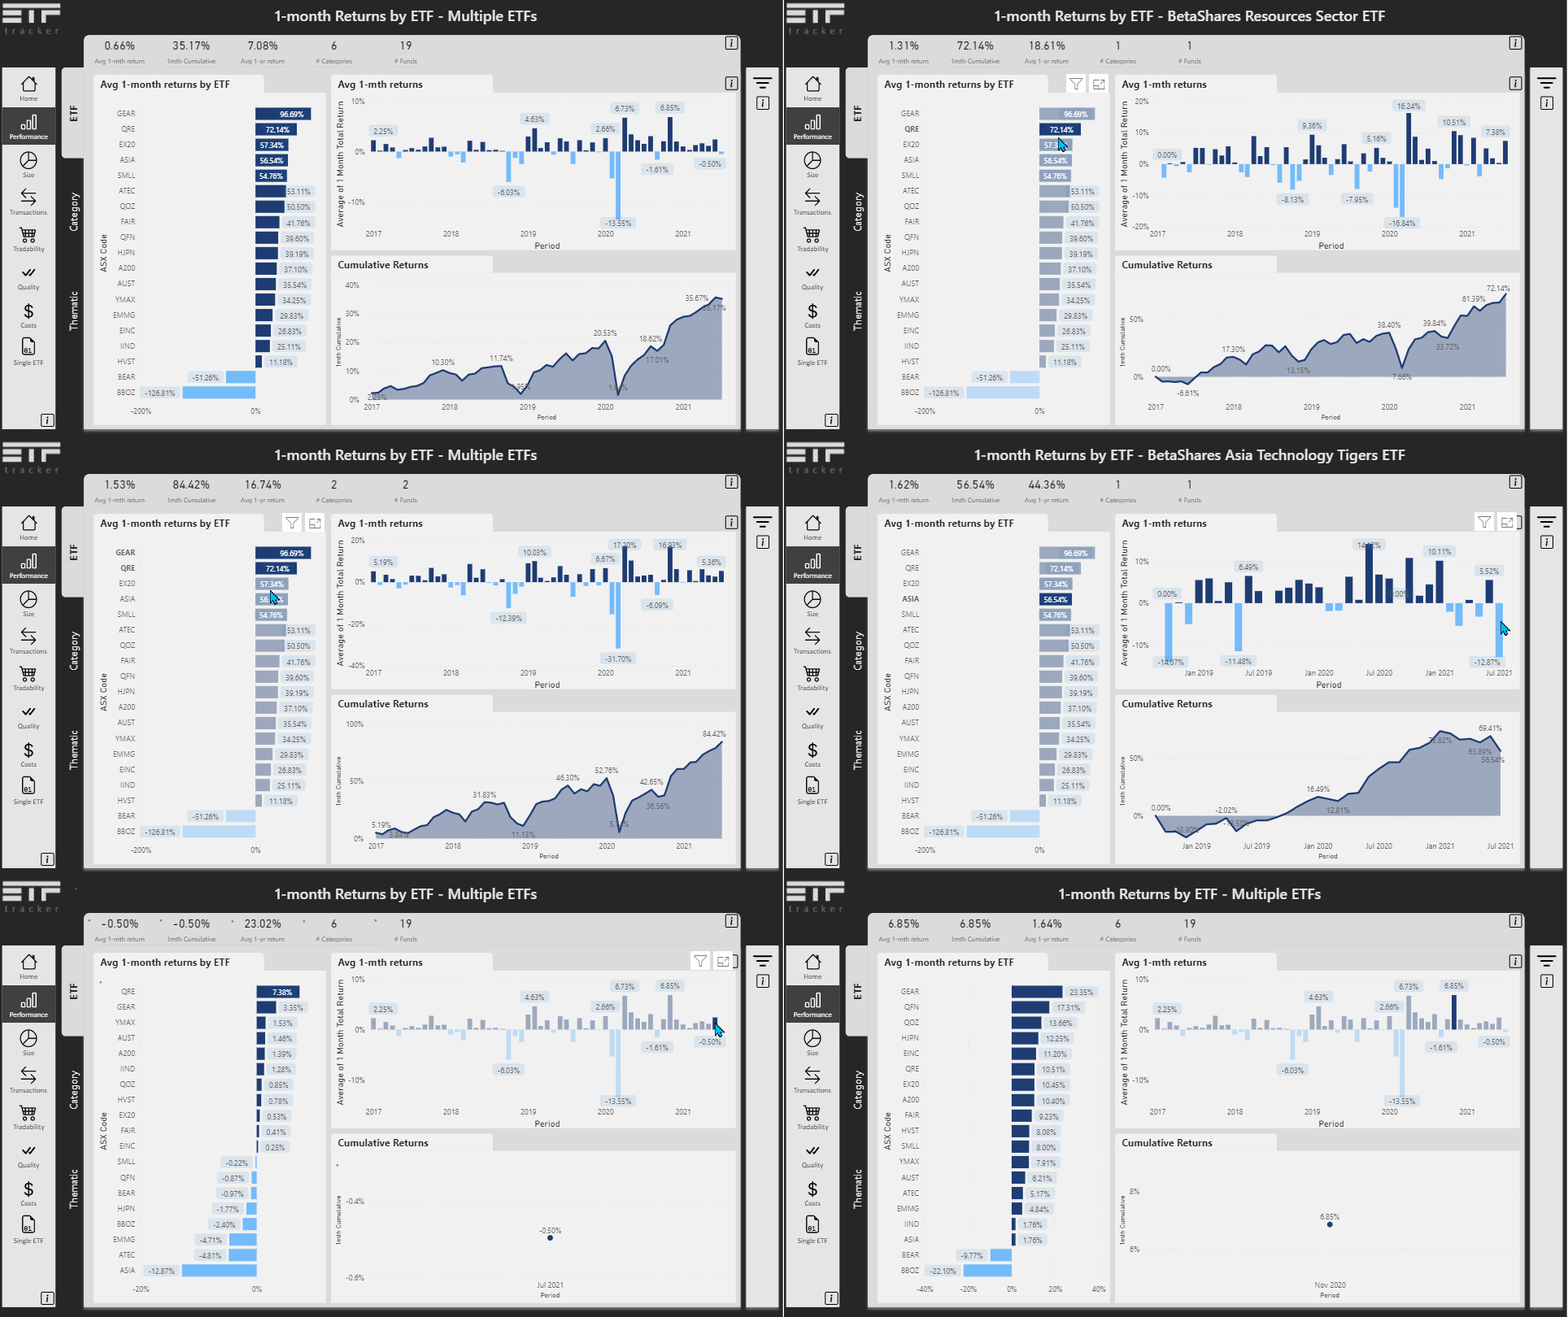
Users can also click on different elements in the charts in ETFtracker to filter other charts as they are all connected. For example, if a user is looking at a bar chart showcasing ETFs, they can click on a bar and it will filter the other charts on the page. In the example below the user clicks on the ranked bar chart but can also filter by the monthly bar chart too.
High-Level View
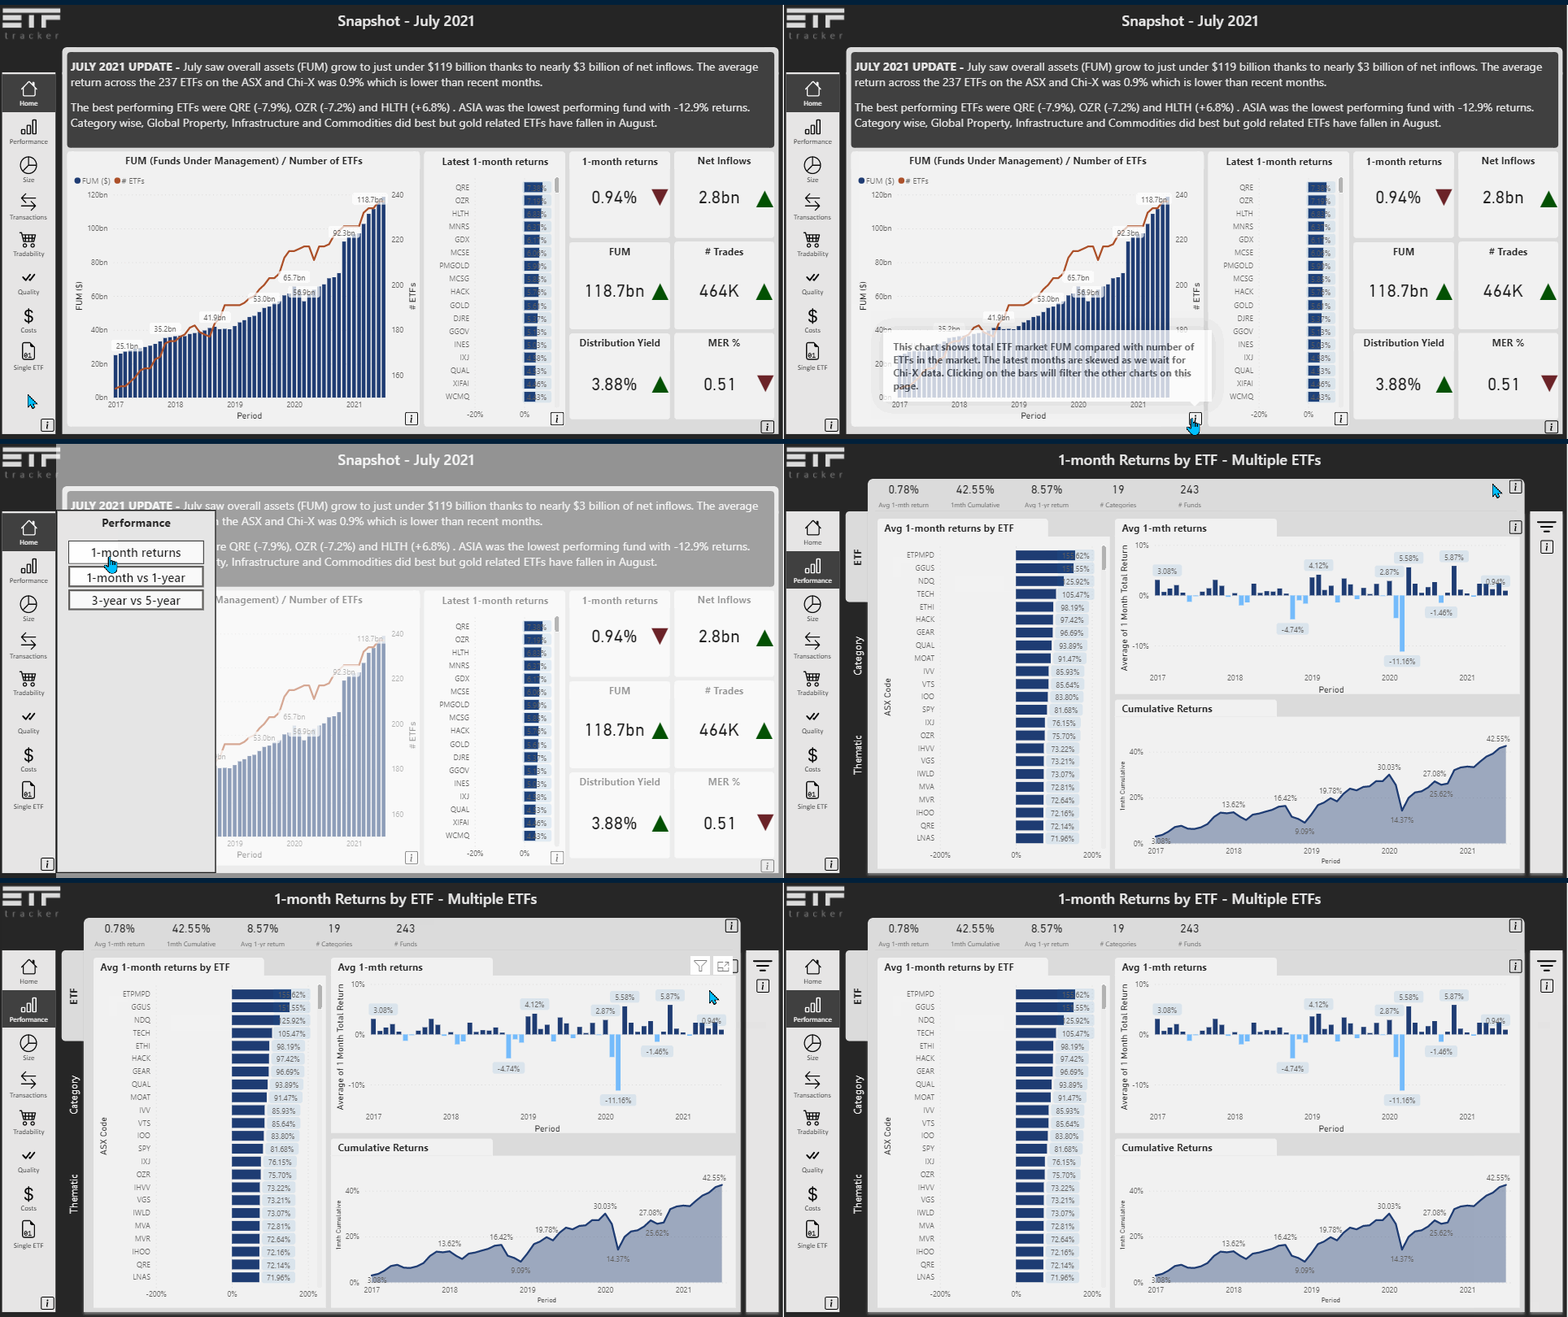
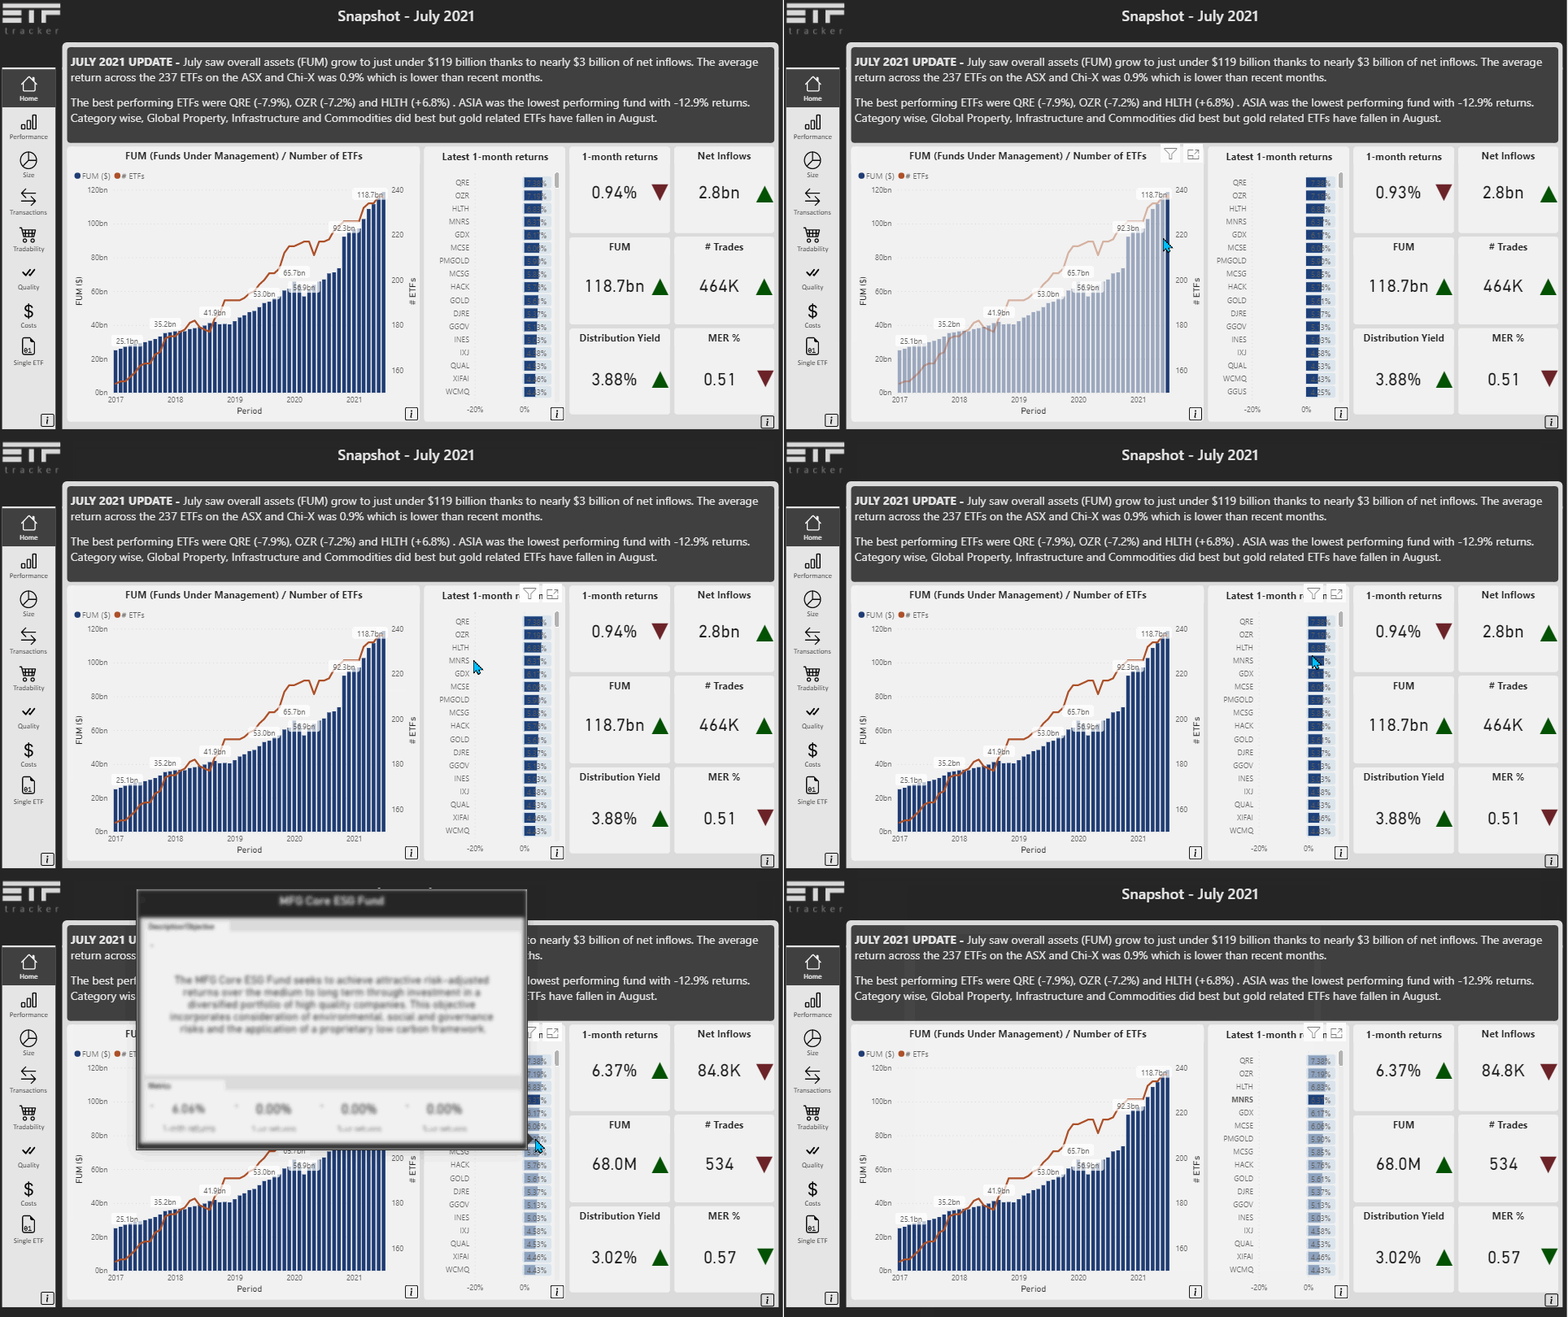
The first option for the user when they get to the app is the High-Level view. This is a page where we present the latest monthly results from the ASX and Chi-X. There are high level metrics of the overall market in terms of FUM growth and number of ETFs as well as who the best and worst performing ETFs were. If a user hovers over the bars they can see more details about the ETF as well.
Additionally there are KPIs showing high-level metrics and what the trend has been over the previou month (see green or red triangles).
The charts on this page are interactive as well so click around!
Analytics
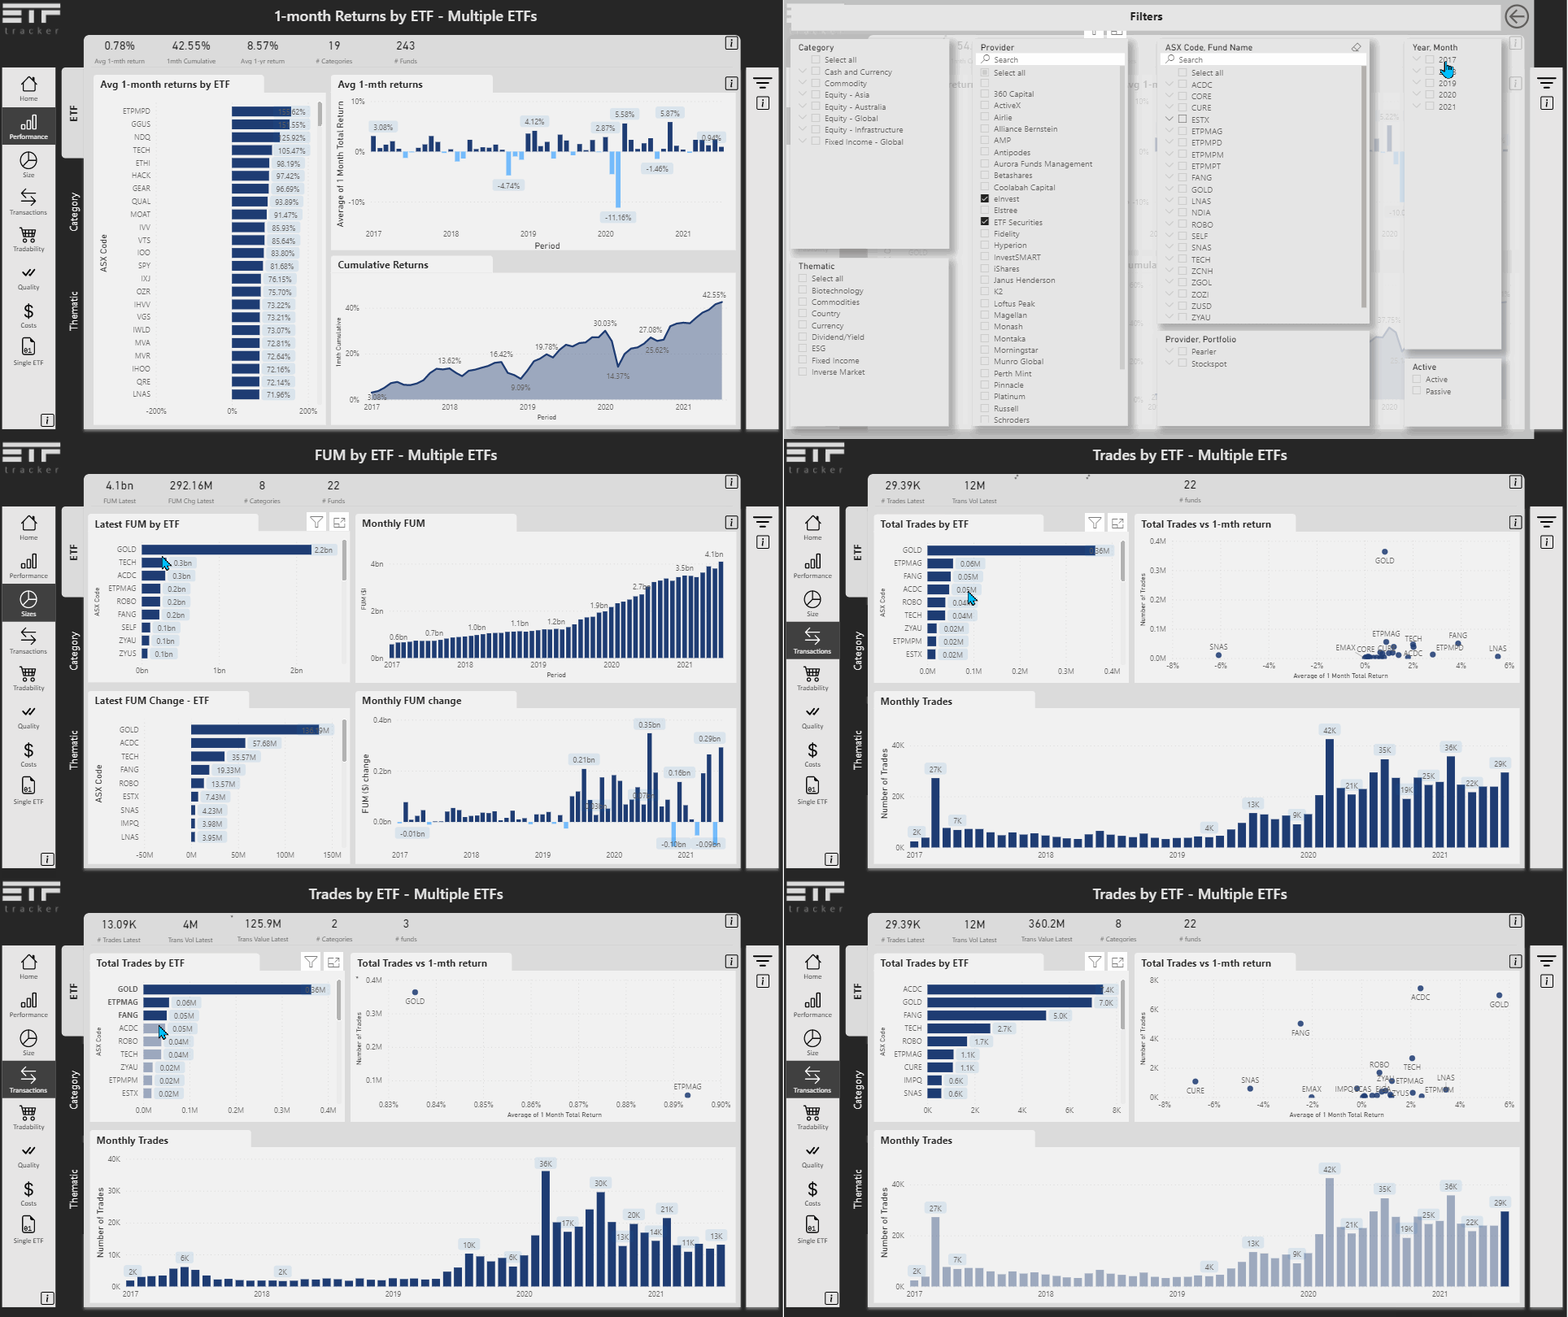
When in the analytics section of the app, users can use the filters to change what's on the page, navigate to different sections and interact with the charts on the page to explore ETF metrics. The analytics pages refer to
-
Performance (1-month, 1-year, 3-year, 5-year total price returns)
-
Size (Net Inflows and FUM)
-
Transactions (Number of Trades and Transaction Volume)
-
Tradability (Liquidity and Spread)
-
Quality (Historical Distribution Yield)
-
Costs (Management Expense Ratio)
ETF Snapshots
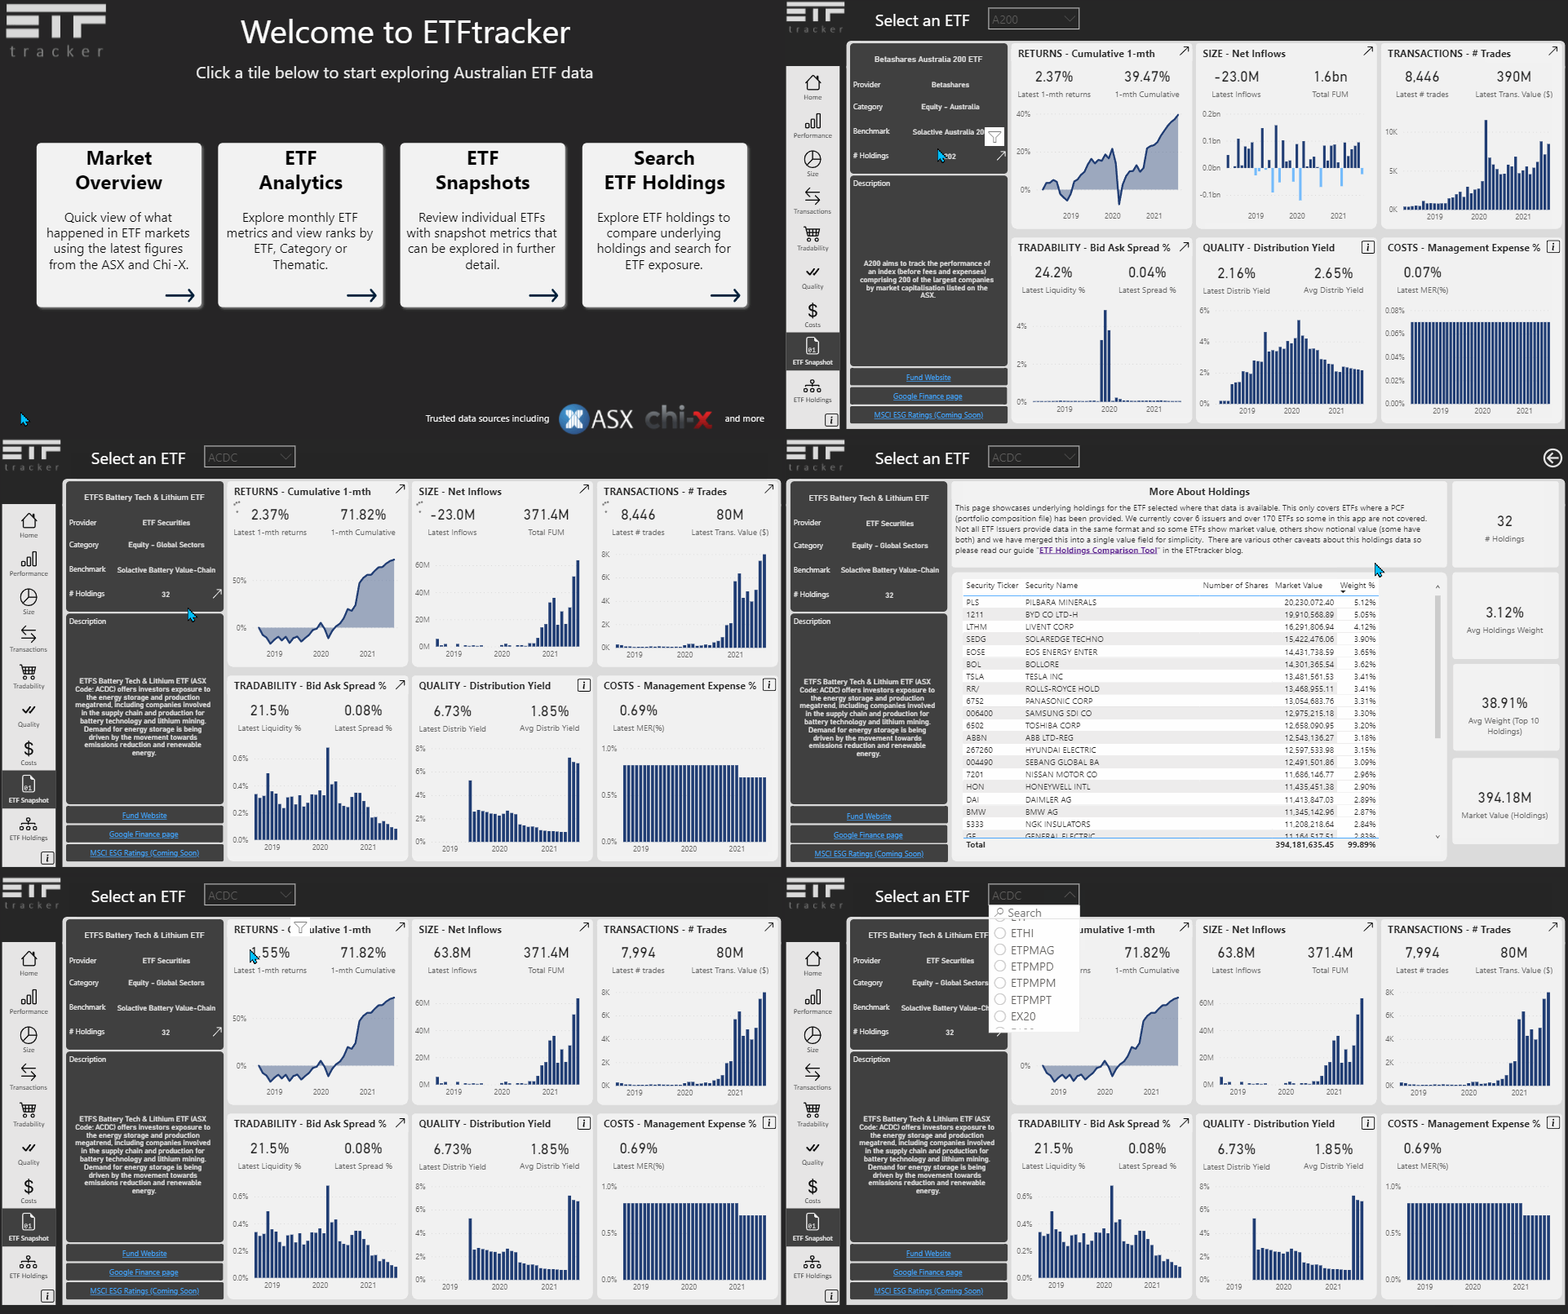
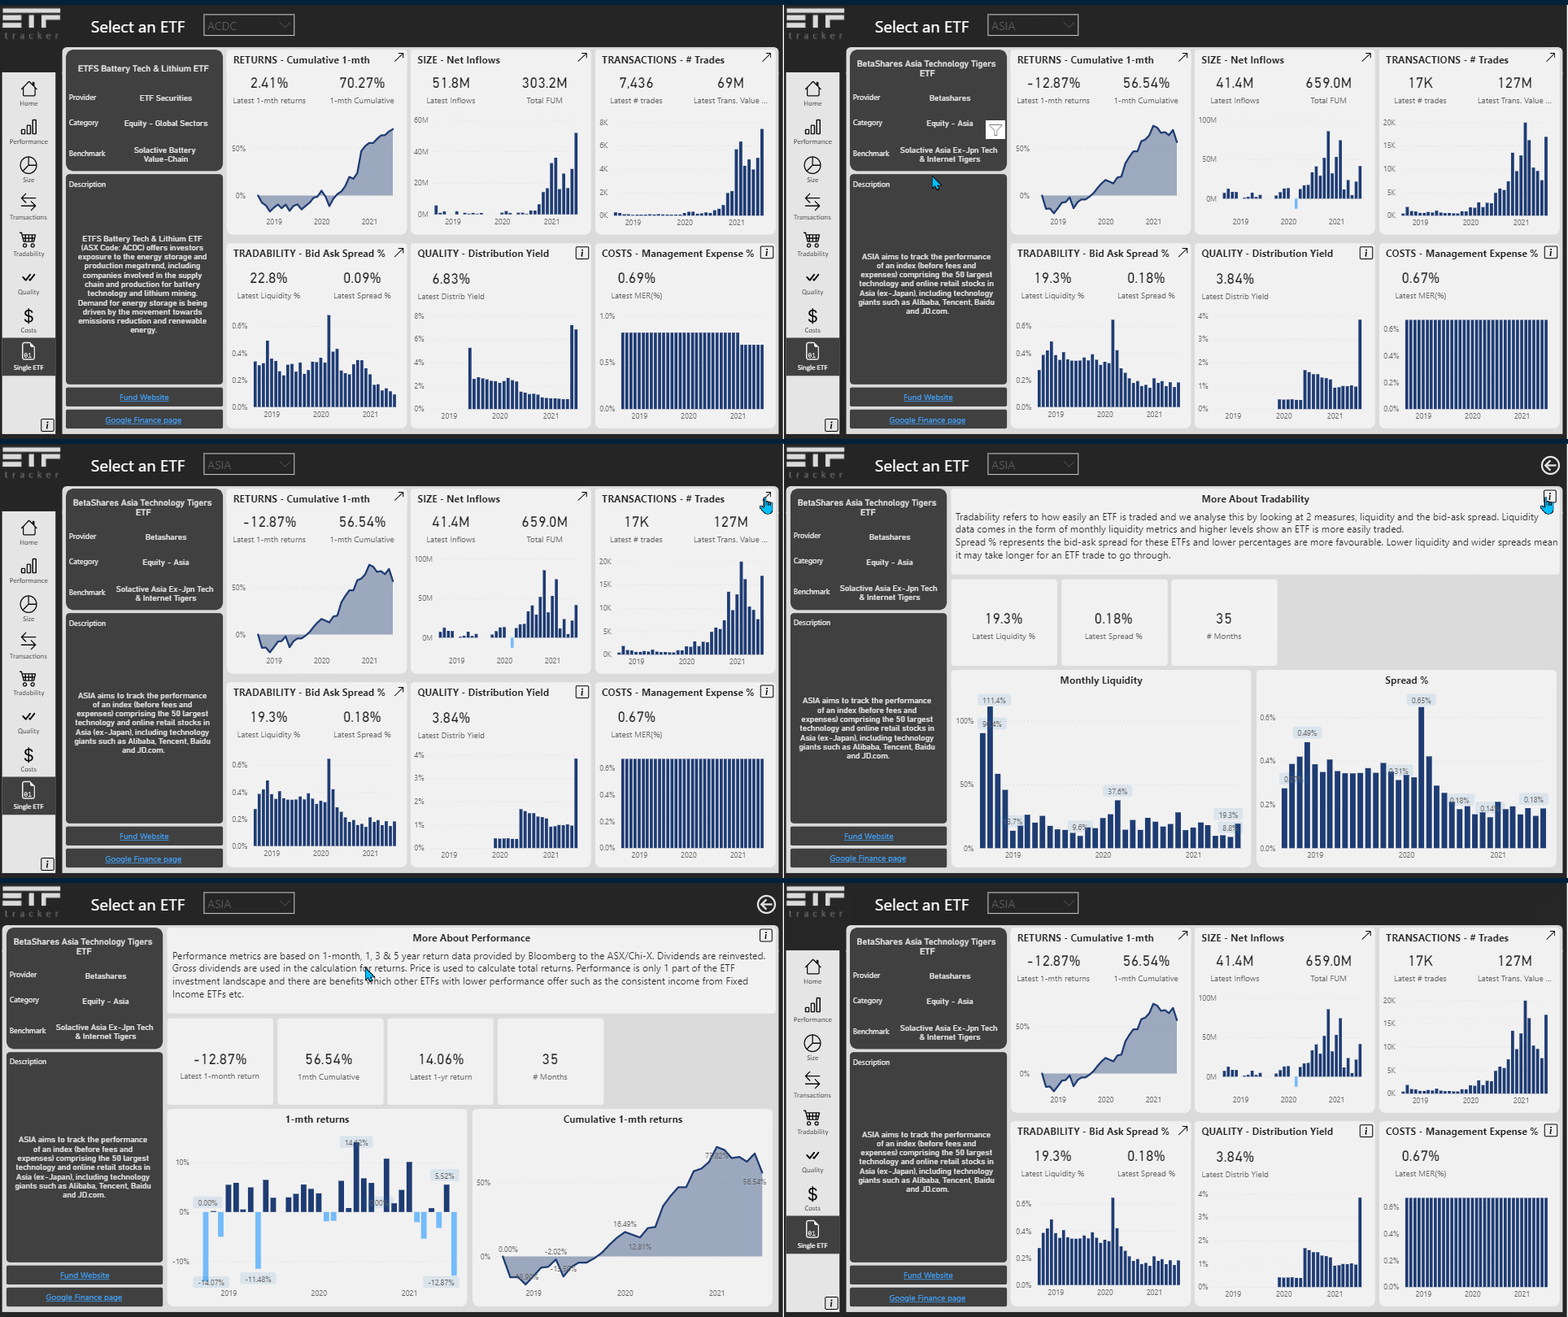
In this section, users can get a snapshot of a single ETF on the 1 page seeing what's happening across important metrics for these funds. Users can pick an ETF from the dropdown (you need to know the ETF ticker code). On the page you get some descriptive data about the ETF on the left-hand side as well as links back to the ETF Issuers fund page and a Google Finance page (for more up to date pricing).
The 6 charts on the page relate to the same metrics as seen in the Analytics section above. These metrics can be further explored by clicking on the links in the tiles (they all have further detailed pages like this except for the Quality and Cost tiles).
ETF Holdings
Bringing ETF Holdings into the main ETFtracker app means that users can compare ETFs and search for particular assets (equities, bonds, other) to see which ETFs they have exposure to. This new feature is the last menu option in the app and the operations work the same as when this sat as a standalone tool. Refer to the guide: ETF Holdings Comparison Guide
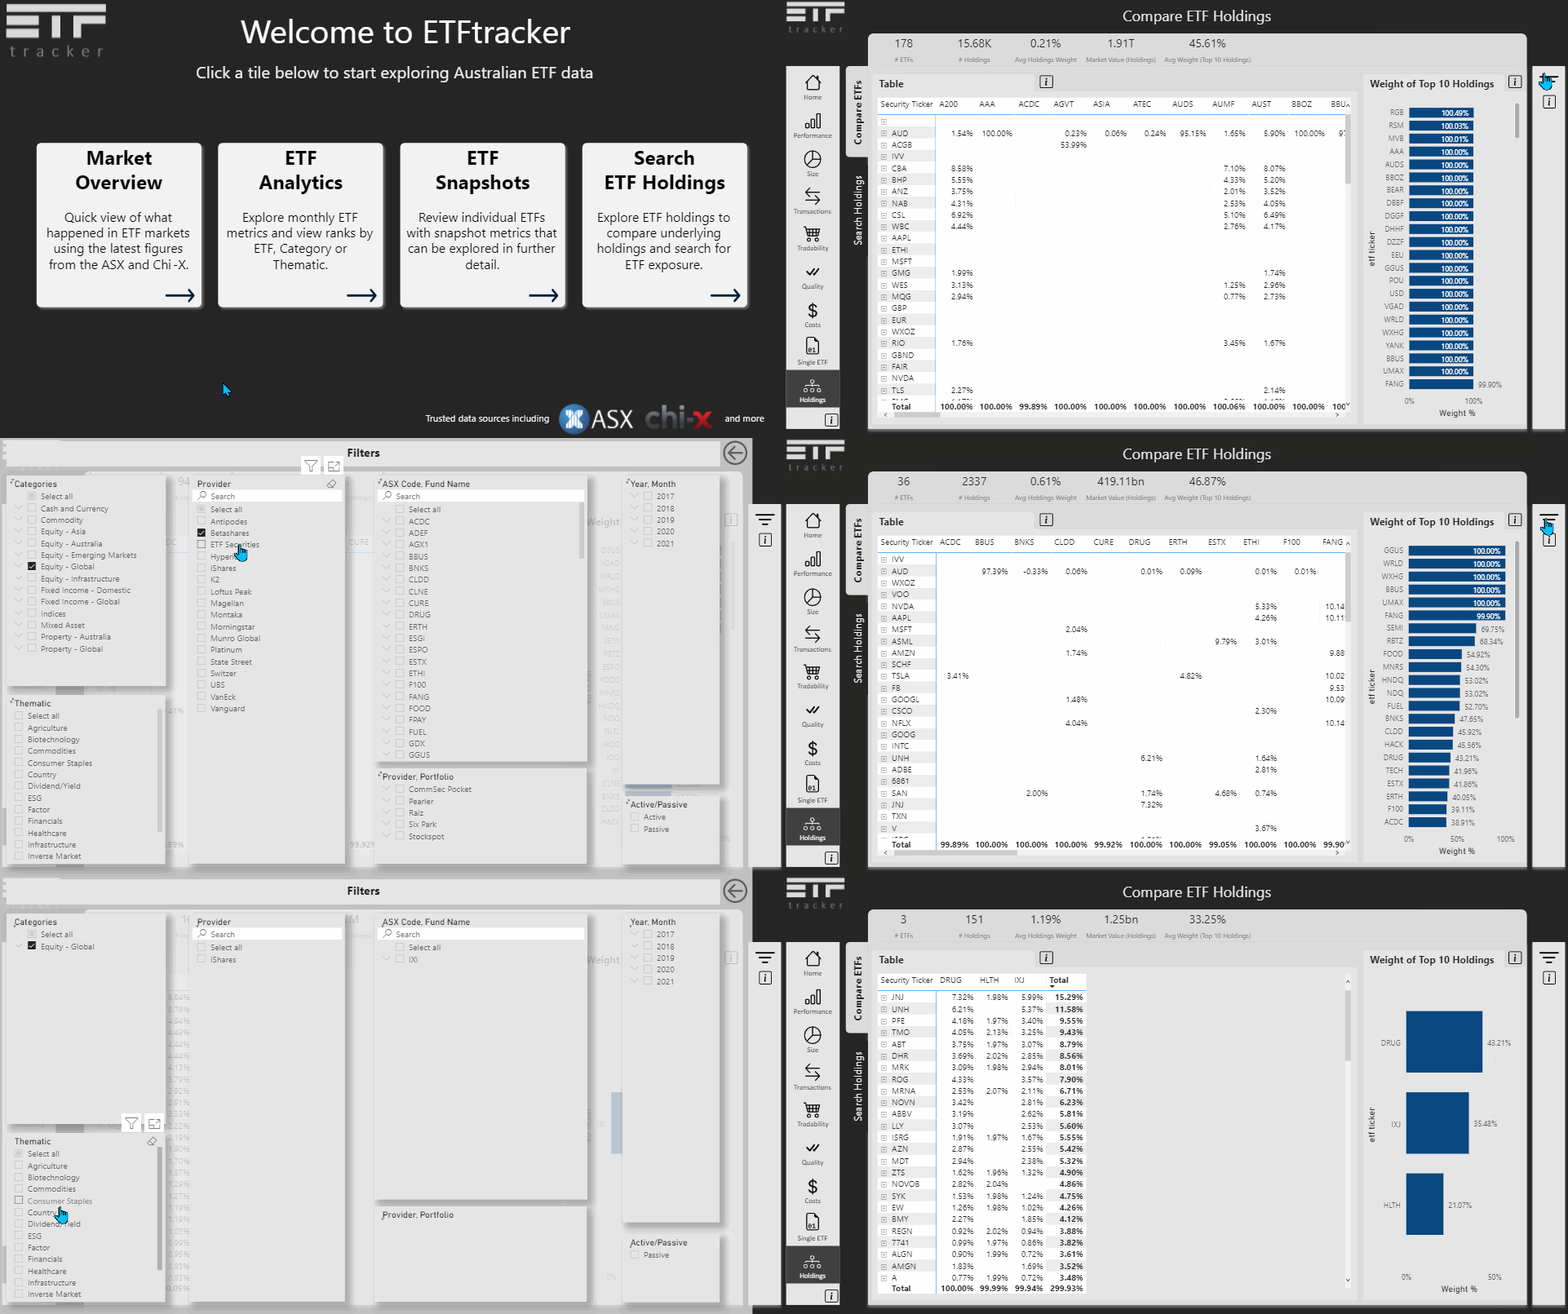
Additionally, the ETF Snapshots also get the holdings data integrated and now whenever an ETF is picked which has holdings data, it will appear in the summary section on the left side of the page as the number of holdings an ETF contains. The white arrow there indicates that users can click on expand to see the holdings in more detail and then the user can click the back arrow button to go back to the main page - similar to how this works in the ETF Snapshot guide above.
